| | | | Kelowna Real Estate News March 2023 Stats We are now exactly 1 year after the peak of the market in March 2022 and it’s the first time we’ve seen upward movement since. All segments have stepped up from a buyers/balanced market, firmly into balanced market territory, and condos even are dipping their toes into a seller’s market. What’s most surprising is reading our major cities report. All markets are reporting a pickup or “early spring market”, with the Greater Toronto Area seeing 70% of the listings selling in a month – they are flying! It feels like there has been an uptick in Kelowna recently, and that’s reflected in the stats below.  You’ll notice some changes in the newsletter this month. we’ve refreshed all of our icons, and graphs – same information, new presentation. We’ve also launched version 1 of our new interactive graph pages. Now you can see graphs for each segment of the market by clicking the links further down the page. You can also find them here.  SINGLE FAMILY HOMES SINGLE FAMILY HOMES
21% of listings selling 80% of sales are under $1.3M Since the peak exactly 1 year ago, the benchmark price is down 14% today to $1 Million even. The lowest was in February at $971K. Was that the bottom? It’s too soon to say, 1 month of change doesn’t form a trend, but this is the first time from the peak that we’ve seen an increase in Benchmark Price (aside from one blip at the peak).
Sales are still lower than we would hope, but ignoring the outrageous pandemic boom sales numbers, we are at 90% of our 10-year averages for March – not so bad! Including the pandemic boom numbers, we are at 75% of the 10-year March sales average.
Without taking the barren listing inventory of the pandemic into our calculations, we are still almost 20% short on listings based on averages. This continues to be the bottleneck of the market, there are simply not enough homes for sale.
Comparing peak month to lowest month for benchmark prices
March 2022 to Febraury 2023: -16.84%
April 2008 to March 2009: -16.85%
I doubled checked the numbers 3 times, I couldn’t believe it!
It is NOT safe to assume everything will happen exactly as it did in 2008, and to be crystal clear, I’m not suggesting that it will; but JUST FOR FUN, if it did, here’s where we would be going if we projected post-2008 price trends to the future.
Unreliable Future Fun-cast
2022 March: $1.168M (April 2008 equivalent)
2023 February: $0.971M (March 2009 equivalent)
2023 March: $1.001M (Today)
2024 March: $1.056M
2024 December: $0.946M
2029 January: $1.020M
2031 July: $1.496M
2032 July: $1.572M (July 2018 equivalent post-2008 correction) 
Click to enlarge
 TOWNHOMES TOWNHOMES
21% of listings selling 80% of sales are under $800K With over twice as many properties for sale compared to this time last year, buyers feel like they have some more options, but still not abundantly so as we are still under our 10-year average. Sales numbers continue to increase into the spring market as expected and are back in line with 2018/2019 numbers. With 21% of the listings selling last month, this is the first time since August last year, that we’ve been firmly in a balanced market.
 CONDOS CONDOS
26% of listings selling
80% of sales are under $600K Condos are outpacing all other segments right now with 26% of the listings selling – their first time in a seller’s market in almost a year! Sales numbers are strong, the first to be in line with our averages, and similar to the large momentum build we had in 2016. The listing inventory continues to creep higher, but many large projects won’t be ready for at least another 1-2 years, so I don’t expect an immediate flood of listings.
Thinking of making a MOVE? 
Send us an email or give us a call at 250-870-8600. Colin is always happy to talk to you about whether it makes sense or not for your situation. | | LUXURY LIVING SPACE STEPS
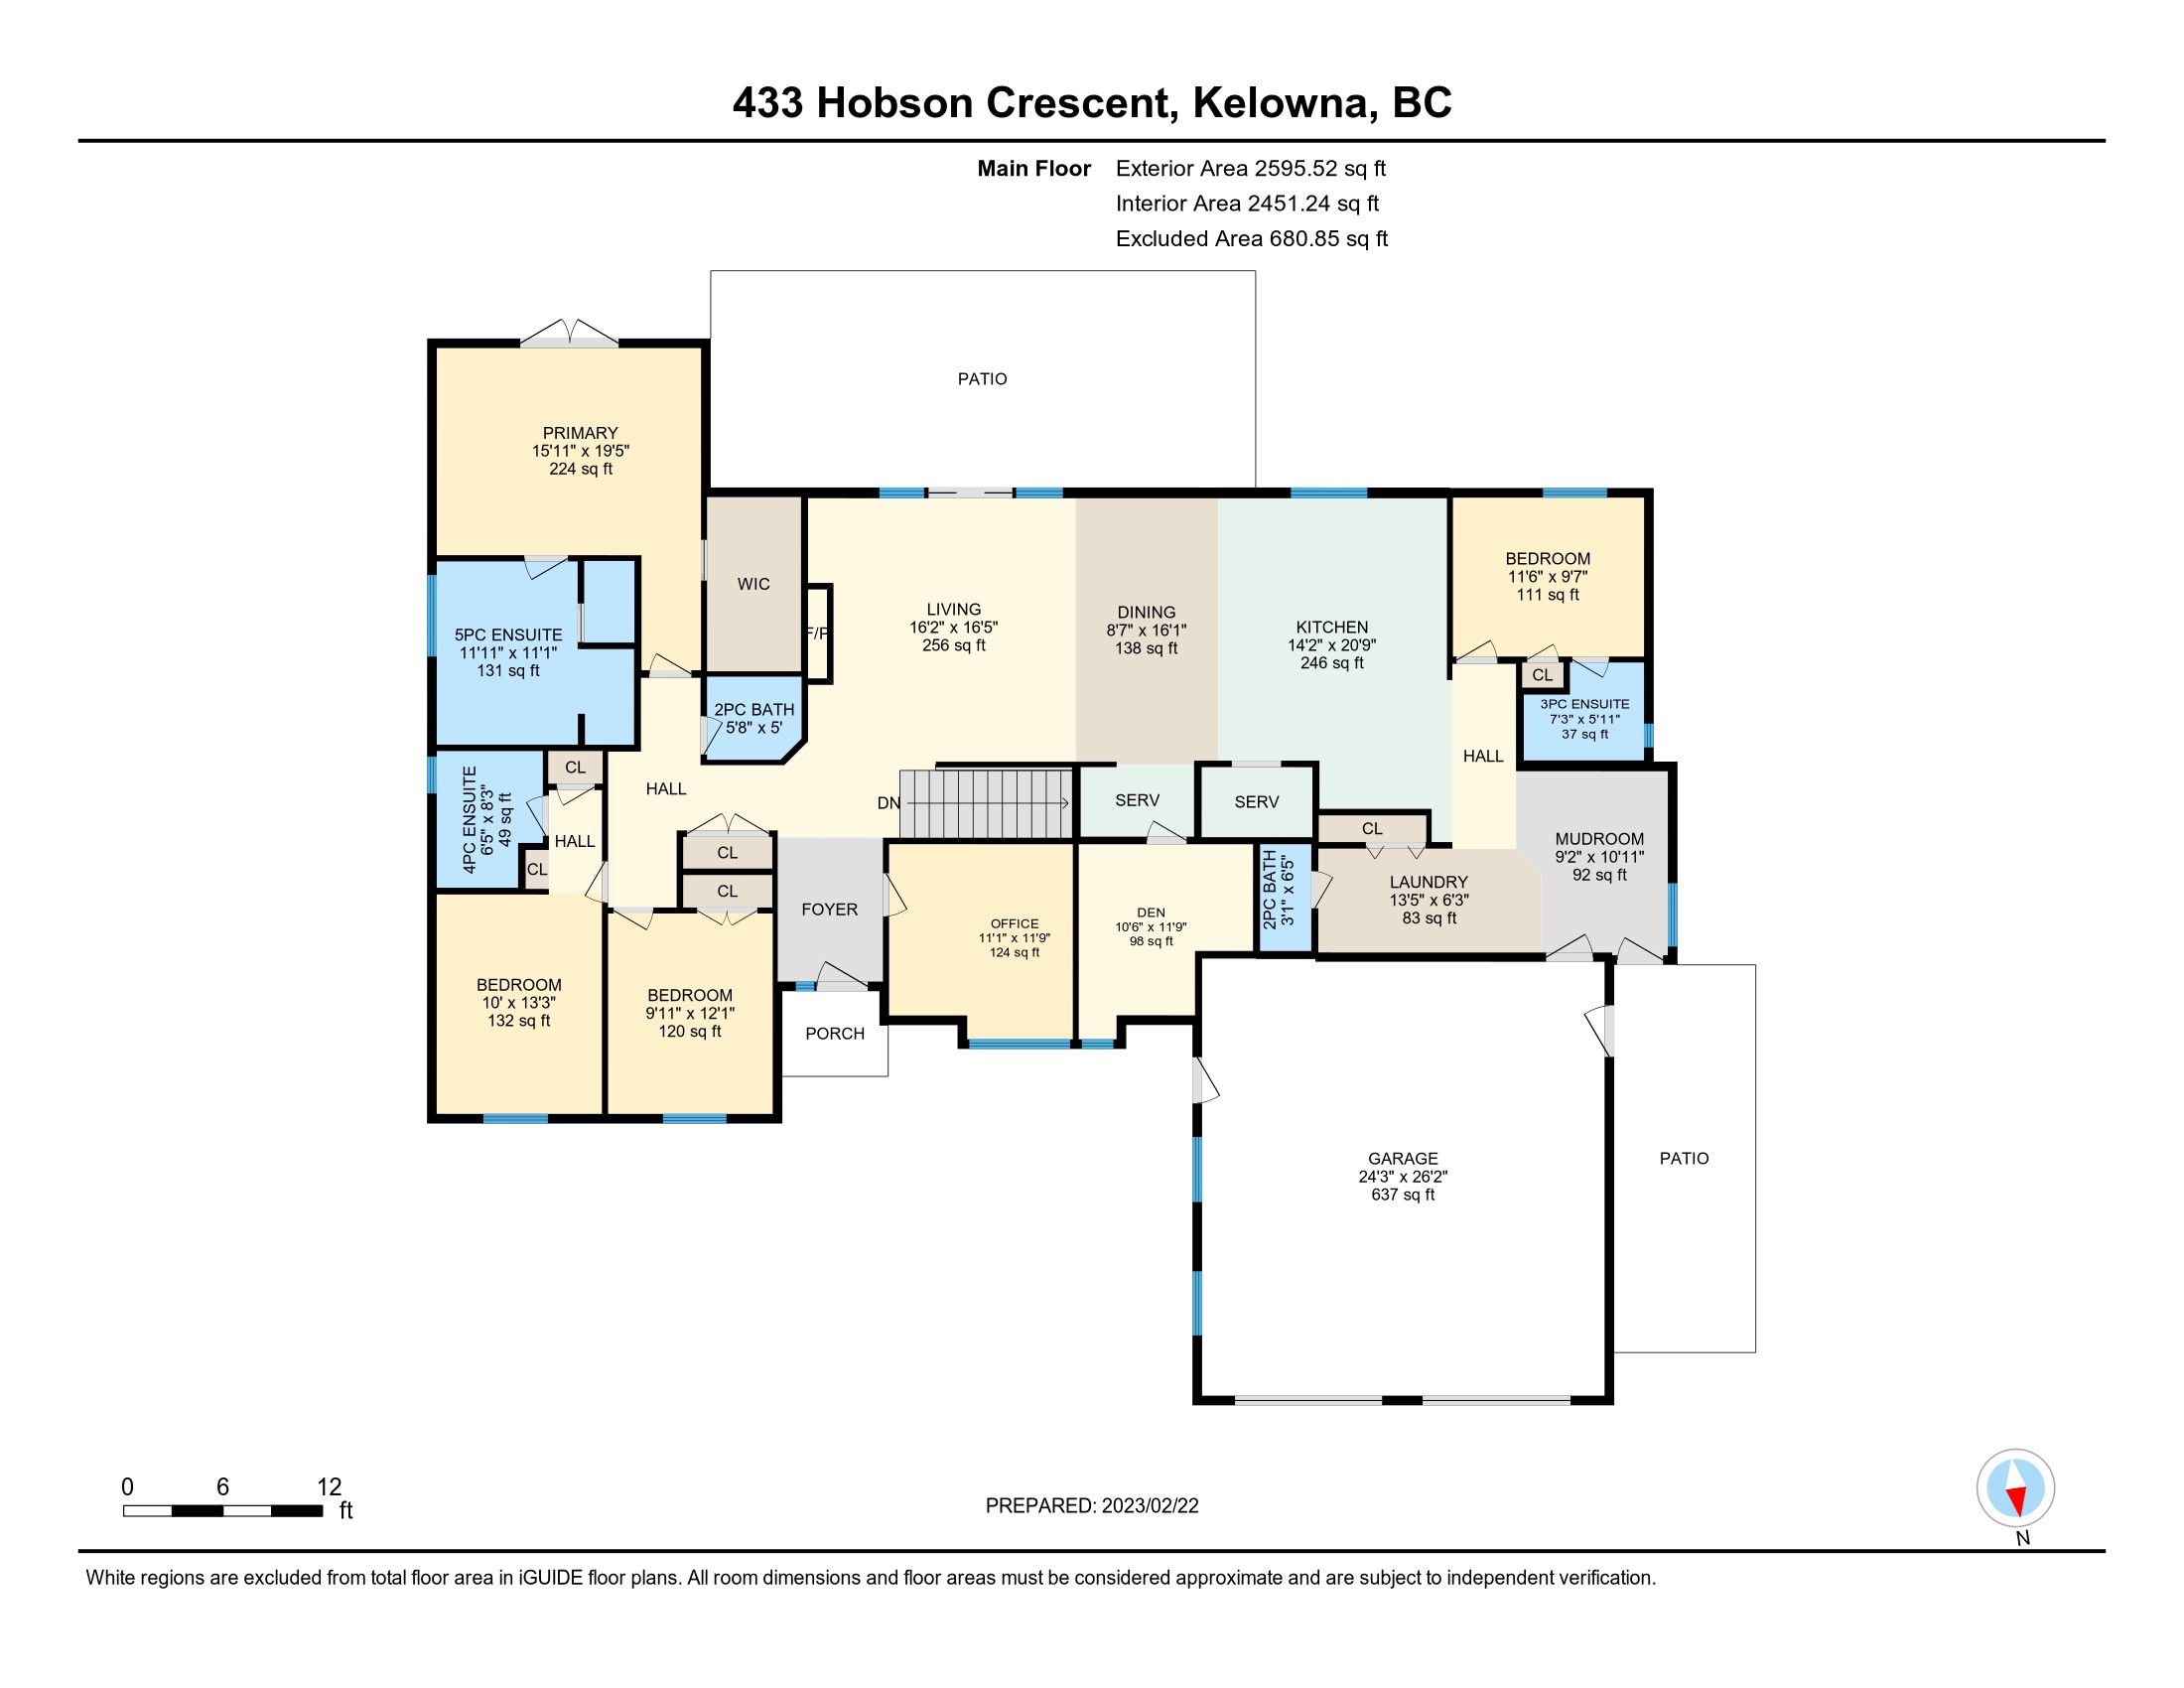
TO THE BEACH! 4 Bedrooms, 6 Bathrooms, 2,600 sqft main floor 433 Hobson Cres, Kelowna, BC
Now Only $2,350,000 | | This MAGNIFICENT 4-bedroom rancher situated in the desirable Lower Mission area is a true testament to the art of refinement. Having completed a $750,000 renovation, no expense was spared in the creation of this stunning home. The open-concept 2,600ft design seamlessly integrates the living room, dining room, & kitchen, providing the perfect venue for hosting guests. The bright & spacious kitchen, with ample counter space & storage, is a chef’s dream, boasting top-of-the-line appl. such as smart fridge, double wall ovens, & Wolf gas range. The butler’s pantry & separate beverage nook, complete w/bar sink & wine fridge, make entertaining a breeze. Indulge in the luxurious comforts of the primary bedroom, a peaceful retreat w/french doors leading to the private backyard, a spacious walk-in closet, & breathtaking 5-pc ensuite featuring soaker tub, oversized glass/tile shower, double sinks, & water closet. 2 addit. private ensuites & 2 powder rooms, all featuring heated floors, provide ample space for family and guests. The cozy reading den is perfect for relaxing after a long day. The oversized mudroom, with built-in bench & shoe storage is a welcome entrance from the beach or garage. The basement offers ample storage space & massive open area of 1,700 sqft, providing endless opportunities to make it your own.Whether you envision a home gym, rec room, or craft room, this area can be easily customized to suit your preferences. Excellent RV parking from Walker Dr. & roughed in for pool. | | Major Cities Report Victoria Early Spring Market Reflects Consumer Confidence And Growing Demand A total of 590 properties sold in the Victoria Real Estate Board region this March, 29.2 per cent fewer than the 833 properties sold in March 2022 but a 28.3 per cent increase from February 2023.
“We’ve seen our sales numbers this month almost double from January,” said Victoria Real Estate Board Chair Graden Sol. “As we move further into spring, we expect that the return to confidence we’ve seen in the market will continue. What we can’t predict is what the overall impact on pricing will be if we continue to see quite low inventory across our community. Some pockets of our market are busier than others..”
There were 1,970 active listings for sale on the Victoria Real Estate Board Multiple Listing Service® at the end of March 2023, an increase of 8.9 per cent compared to the previous month of February and an 85.3 per cent increase from the 1,063 active listings for sale at the end of March 2022. “Demand is recovering,” adds Sol. “Compared to the end of 2022, prices have firmed up and interest rates have become normalized. Consumers are more active, and we are seeing quite a few multiple offers on well-priced properties.”
Source Vancouver Spring Brings Price Growth While New Listings Remain Dormant The Real Estate Board of Greater Vancouver (REBGV) reports that residential home sales in the region totaled 2,535 in March 2023, a 42.5 per cent decrease from the 4,405 sales recorded in March 2022, and 28.4 per cent below the 10-year seasonal average (3,540). “On the pricing side, the spring market is already on track to outpace our 2023 forecast, which anticipated modest price increases of about one to two per cent across all product types. The surprising part of this recent activity is that these price increases are occurring against a backdrop of elevated borrowing costs, below-average sales, and new listing activity that continues to suggest that sellers are awaiting more favorable market conditions.” said Andrew Lis, REBGV director of economics and data analytics The MLS® Home Price Index composite benchmark price for all residential properties in Metro Vancouver is currently $1,143,900. This represents a 9.5 per cent decrease over March 2022 and a 1.8 per cent increase compared to February 2023.
Source Calgary Prices Rise As Conditions Favor The Seller Sales and new listings have improved over the levels reported at the beginning of the year. As a result, the spread between sales and new listings supported some expected monthly inventory level gains. However, the 3,233 available units reflected the lowest March inventory levels since 2006 and left the months of supply just above one month, firmly in the seller’s territory. While conditions are not as tight as last March, low inventory levels leave purchasers with limited choice, once again driving up home prices.
“As expected, sales have eased from record levels while remaining stronger than they were before the pandemic thanks to recent gains in migration supporting demand,” said CREB® Chief Economist Ann-Marie Lurie “The challenge has been centered around supply. As a result, existing homeowners may be reluctant to list as they struggle to find an acceptable housing alternative in this market. At the same time, higher lending rates can also reduce the incentives for existing homeowners to list their home.”
Total unadjusted residential home prices reached $541,800 in March, a two per cent gain over last month and nearly one per cent higher than prices reported last year.
Source
Edmonton
Spring Market Has Sprung As Edmonton Sees Month-Over-Month Growth Total residential unit sales in the Greater Edmonton Area (GEA) real estate market for March 2023 decreased 44.6% compared to March 2022 but saw an increase of 42.1% from February 2023. New residential listings were down 22% year-over-year from March 2022, while also noting an increase of 32.3% from February 2023. Overall inventory in the GEA was up 22.1% from March of last year, and up 11.8% from the previous month.
“We continue to see market activity pick up as the days begin to warm up as average prices and days on market continue to improve month-over-month,” says REALTORS® Association of Edmonton 2023 Board Chair Melanie Boles. “I think it’s safe to say that the spring market is here and in full force”.
The MLS® Home Price Index (HPI) composite benchmark price* in the GEA came in at $377,900, resulting in an increase of 1.7% from February 2023, but a decrease of 7.8% from March 2022.
Source Toronto Tight Market Conditions Push up Competition In The GTA Greater Toronto Area (GTA) housing market conditions tightened in March 2023. Sales accounted for an increased share of listings in comparison to March 2022, suggesting that competition between buyers is on the rise. The average sale price was above the average list price for the first time since May 2022.
“As we moved through the first quarter, Toronto Regional Real Estate Board (TRREB) Members were increasingly reporting that competition between buyers was heating up in many GTA neighbourhoods. The most recent statistics bear this out,” said TRREB President Paul Baron. “Recent consumer polling also suggests that demand for ownership housing will continue to recover this year. Look for first-time buyers to lead this recovery, as high average rents move more closely in line with the cost of ownership.”
GTA REALTORS® reported 6,896 sales through TRREB’s MLS® System in March 2023 – down 36.5 per cent compared to March 2022. On a month-over-month basis, actual and seasonally adjusted sales were up. New listings were also down on a year-over-year basis, but by a much greater annual rate. This points to tighter market conditions compared to last year.
Source | | | | | | | |